
Revenue churn rate measures the percentage of monthly recurring revenue (MRR) lost when customers cancel or downgrade. It is a financial health check for any subscription business. It shows the real monetary impact of losing customers. This guide provides a practical workflow for measuring and reducing your revenue churn rate.
What Revenue Churn Rate Reveals About Your Business
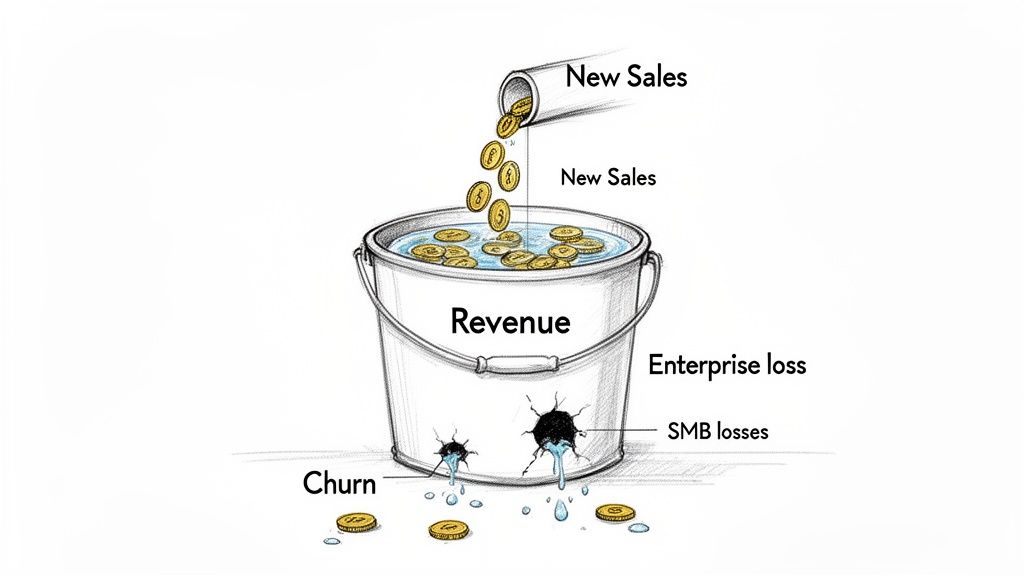
Imagine your revenue is water in a bucket. Your sales team adds new revenue through inbound vs outbound efforts. Churn creates a leak. The revenue churn rate measures how fast that money is draining.
This metric focuses on financial impact, not just customer count. Losing ten small accounts might have a minor impact. Losing one enterprise client could threaten your quarterly goals. Revenue churn tells you exactly how much money you are losing from existing customers.
Tracking this metric helps you understand your business's stability. It shows whether you are losing high-value accounts or a steady stream of smaller ones. This information helps you create an effective retention strategy.
Why This Metric Matters for Growth
Understanding revenue churn is the first step to building a sustainable business. It provides the insight you need to:
Create Accurate Financial Forecasts: Knowing your churn rate makes revenue projections more reliable.
Prove Business Stability: Low revenue churn shows investors you have a stable customer base.
Identify Product or Service Gaps: A rising churn rate can be an early warning that customers are unhappy.
Optimize Retention Efforts: It shows where to focus resources for the biggest financial return.
Industry data shows the average monthly B2B SaaS churn rate was around 3.5% in early 2024. This is down from a peak of 7.5% in late 2021. Knowing these benchmarks helps you stay competitive.
How to Calculate Your Revenue Churn Rate
Calculating revenue churn does not require advanced skills. Two formulas provide a clear picture of your company's financial momentum. We will cover both Gross Revenue Churn and Net Revenue Churn. Gross churn shows lost revenue. Net churn includes revenue growth from existing customers.
Measuring Gross Revenue Churn
Gross Revenue Churn measures the total MRR you lost from cancellations and downgrades in a period. This calculation ignores any revenue gained from upgrades. It is a direct look at the financial impact of customer attrition.
The formula is:
Gross Revenue Churn Rate = (Churned MRR / Starting MRR) * 100
Here are the definitions:
Churned MRR: Total MRR lost from customers cancelling or downgrading.
Starting MRR: Total MRR at the beginning of the period.
Example Workflow:
Define the period: Let's use April.
Find Starting MRR: Your company started April with £100,000 in MRR.
Calculate Churned MRR:
Cancellations resulted in £5,000 of lost MRR.
One customer downgrade reduced MRR by £1,000.
Total Churned MRR = £5,000 + £1,000 = £6,000.
Apply the formula:
(£6,000 / £100,000) * 100 = 6% Gross Revenue Churn.
The company lost 6% of its starting revenue in April.
Calculating Net Revenue Churn
Gross churn is only part of the story. You also need to account for existing customers who spend more. Net Revenue Churn provides this balanced view.
This metric subtracts revenue gained from upgrades (Expansion MRR) from your Churned MRR. It shows whether your existing customer base is growing or shrinking in value.
The formula adds one new element:
Net Revenue Churn Rate = [(Churned MRR - Expansion MRR) / Starting MRR] * 100
The new term is:
Expansion MRR: New MRR from current customers who upgraded, added users, or bought add-ons.
Example Workflow (continued):
Use the same period: April.
Gather the data:
Starting MRR: £100,000.
Churned MRR: £6,000.
Calculate Expansion MRR:
Several customers upgraded their plans, adding £8,000 in new MRR.
Apply the formula:
[(£6,000 - £8,000) / £100,000] * 100 = -2% Net Revenue Churn.
A negative number is a positive result. This is called negative churn.
Gross vs Net Revenue Churn Calculation Walkthrough
This table provides a side-by-side comparison using our example. It shows how expansion revenue changes the financial picture.
Metric | Gross Revenue Churn Example | Net Revenue Churn Example |
|---|---|---|
Starting MRR | £100,000 | £100,000 |
Churned MRR (Cancellations + Downgrades) | -£6,000 | -£6,000 |
Expansion MRR (Upgrades + Add-ons) | Not included | +£8,000 |
Net Revenue Change | -£6,000 | +£2,000 |
Formula | (£6,000 / £100,000) * 100 | ([£6,000 - £8,000] / £100,000) * 100 |
Final Churn Rate | 6.0% | -2.0% |
The company lost 6% of its revenue from churn. However, growth from remaining customers was strong enough to produce a net revenue gain.
The Power of Negative Churn
Negative revenue churn means your business is growing even without acquiring new customers. The revenue from existing customers expanding their service exceeds the revenue lost from churn. This indicates a healthy business with a product that delivers increasing value.
Understanding Revenue Churn vs Customer Churn
It is critical to distinguish between revenue churn and customer churn. They tell different stories about business health. Confusing them can create a false sense of security.
Customer churn is a headcount of lost customers. A small startup and a large enterprise are both counted as one lost customer.
Revenue churn measures the monetary value lost. It focuses on the financial impact, providing a more accurate picture of how churn affects your bottom line.
Why the Difference Is So Important
Consider a SaaS company with three customer tiers.
100 Small Customers at £100/month each (£10,000 MRR)
20 Medium Customers at £1,000/month each (£20,000 MRR)
5 Enterprise Customers at £10,000/month each (£50,000 MRR)
Total starting MRR is £80,000 from 125 customers.
This month, the company loses five small customers and one enterprise customer.
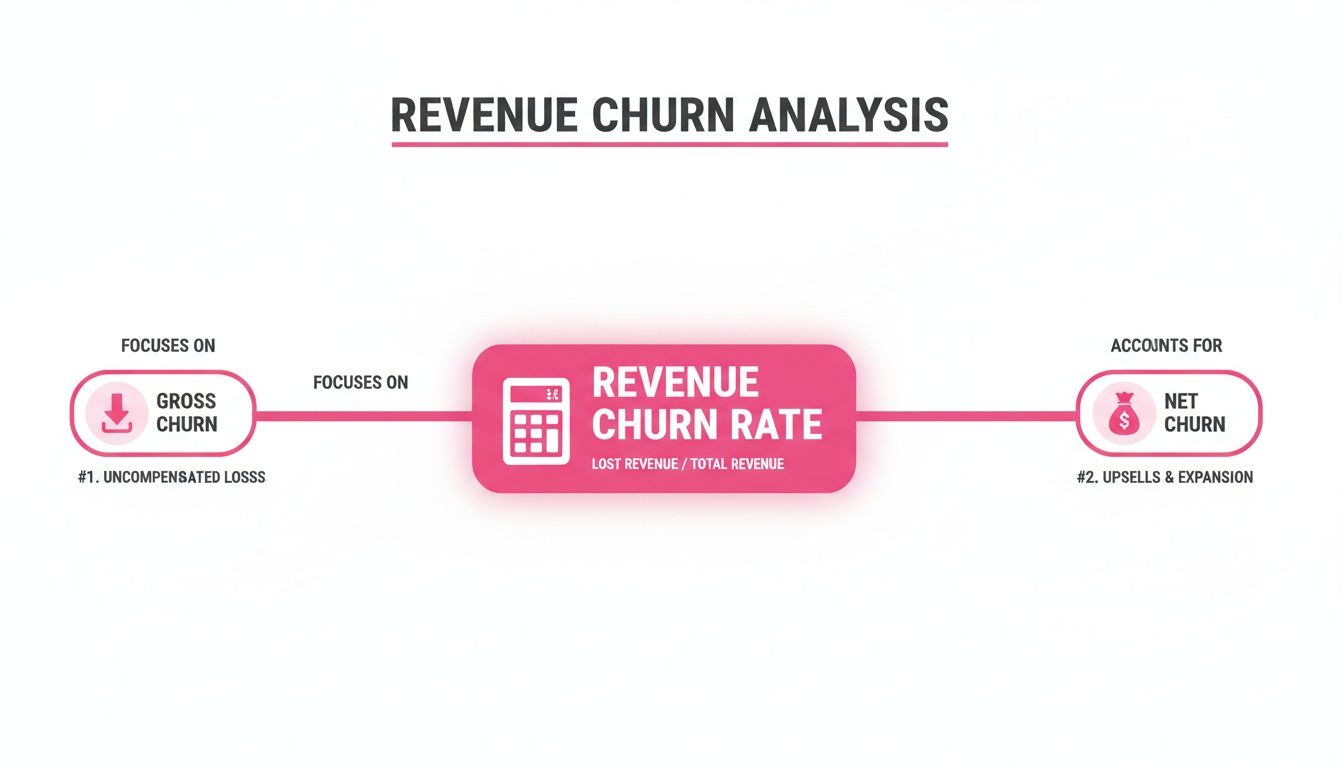
This diagram shows how Gross Churn measures only lost revenue, while Net Churn includes expansion revenue for a complete view.
The Churn Calculation Showdown
Here is how the two metrics reflect this scenario.
Customer Churn Calculation: You lost six customers (five small + one enterprise) from a starting total of 125.
(6 Lost Customers / 125 Starting Customers) * 100 = 4.8% Customer Churn
A 4.8% customer churn rate might seem manageable.
Revenue Churn Calculation: You lost £500 from the five small customers (5 x £100). You lost £10,000 from the one enterprise client. Total lost MRR is £10,500.
(£10,500 Lost MRR / £80,000 Starting MRR) * 100 = 13.1% Revenue Churn
Result: The business had a 4.8% customer churn but a 13.1% revenue churn. The financial damage was almost three times worse than the customer count suggested.
This example shows why relying only on customer churn is a blind spot. It masks the financial impact of losing high-value accounts. Track both metrics to get an unfiltered view of business performance.
Finding the Root Causes of Your Revenue Churn
Knowing your churn rate is a starting point. It tells you what is happening, but not why. To reduce churn, you must investigate the reasons customers downgrade or leave. This requires a shift from tracking metrics to active problem-solving.
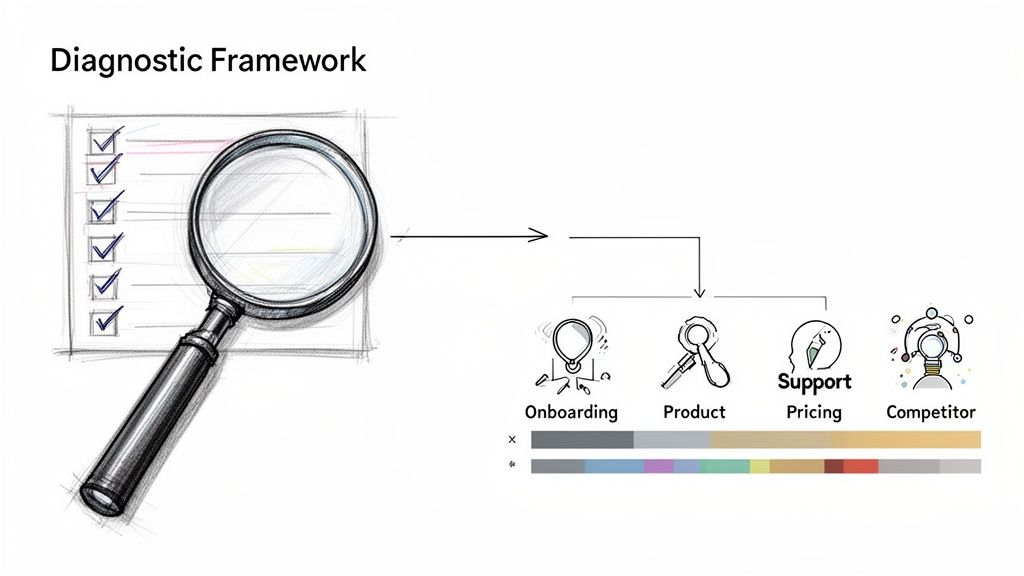
A Diagnostic Framework for Churn
Use a structured checklist to investigate potential issues. This helps your Revenue Operations and Customer Success teams identify vulnerabilities.
1. Poor Onboarding and Initial Value
A confusing setup process creates frustration. If customers do not see value quickly, they are more likely to churn.
Checklist:
Do new customers achieve a quick "aha!" moment?
Is onboarding tailored to customer goals?
Are customers adopting key features early?
2. Product Gaps or Performance Issues
The product may lack a critical feature or have performance problems. If a product does not deliver on its promise, customers will look for alternatives. Track feature requests and bug reports from churned customers to identify gaps.
3. Ineffective Customer Support
Slow response times or unresolved issues damage trust. Poor support makes customers feel undervalued and pushes them to competitors.
4. Pricing and Perceived Value
Customers may feel the price is too high for the value they receive. A competitor might offer a similar product for less. The price must align with the real-world value customers get from your product.
How to Systematically Investigate Churn
To use this framework, segment your churn data. An overall churn rate can hide important patterns. Breaking down the data helps you see where the problem is most severe.
Segmentation Checklist:
[ ] By Customer Segment: Are you losing more enterprise clients or small businesses?
[ ] By Subscription Plan: Is churn higher on your basic or premium plan?
[ ] By Industry: Do customers in a specific industry churn more often?
[ ] By Acquisition Channel: Do customers from a certain ad campaign leave faster?
Detailed analysis focuses your efforts where they will have the greatest impact. For example, Telefónica Brasil achieved a low 0.7% churn rate for multi-service customers by bundling services. This shows how integrated value builds customer loyalty. You can read the full report on investing.com.
Actionable Strategies for Reducing Revenue Churn
Knowing your churn rate is the first step. The real work is actively reducing it. This requires a mix of proactive and reactive strategies to improve the customer experience and demonstrate value. The best way to reduce churn is to address issues before a customer considers leaving.
Proactive Strategies to Prevent Churn
These strategies help create a positive customer journey and identify risks before they become problems.
1. Nail Your Customer Onboarding
A smooth onboarding process is essential. The goal is to get customers to their "aha!" moment as quickly as possible.
Action Steps:
Personalize the experience: Tailor onboarding to what the customer wants to achieve.
Provide guidance: Use interactive walkthroughs and easy access to support.
Showcase key features first: Highlight features that deliver an immediate win.
2. Keep an Eye on Customer Health Scores
A customer health score is an early warning system. It combines data like login frequency, feature usage, and support tickets to predict churn risk. Tracking these scores allows your Customer Success team to intervene with support or training before a customer disengages.
3. Set Up Regular Business Reviews
Schedule regular check-ins with your most important accounts. Quarterly Business Reviews (QBRs) are a chance to review progress and reinforce the value you provide. Use these strategic conversations to understand their changing business goals and show how your product can help them succeed.
Reactive Strategies to Retain At-Risk Accounts
When a customer is at risk of churning, you need a plan to win them back.
1. Create Smart Offboarding Surveys
When a customer cancels, use an exit survey to capture feedback. Keep the survey short and focused on the main reason for their decision. This feedback helps your product and success teams fix the root causes of churn.
2. Prepare Targeted Retention Offers
A timely offer can retain a customer. If price is the issue, offer a temporary discount. If they need an upcoming feature, provide early beta access. Make the offer relevant to their reason for churning. It shows you are listening and willing to find a solution.
Using Technology to Uncover Churn Signals
Manually tracking customer interactions for churn signals is difficult. Technology can automatically spot risks in customer conversations.
For example, a platform like Samskit can join, record, and transcribe customer calls. Its analysis flags churn indicators like mentions of competitors or budget concerns. This information is sent to your CRM, giving your account managers the context to act proactively. A clear history of every promise and pain point helps your team deliver a more responsive experience. You can find new ways to find customers in our guide on prospecting with similar technologies.
This data-driven approach is becoming standard. The customer analytics market in Brazil is expected to reach USD 1,470.4 million by 2030. This shows a shift toward using data to understand and retain customers. You can discover more about the growing Brazilian customer analytics market.
Best Practices for Tracking and Reporting Churn
Effective churn management requires a consistent and accurate reporting system. The goal is to build a framework that provides clear strategic direction.
Start by setting a regular reporting cadence. Monthly reports work well for frontline teams like Customer Success. This frequency allows them to spot trends and act quickly. Leadership teams usually benefit from a quarterly view. This higher-level perspective helps them assess long-term strategies and make investment decisions.
Building Your Revenue Churn Dashboard
Create a single source of truth for all churn metrics. A good dashboard provides a clear, at-a-glance view of performance.
Dashboard Template - Key Metrics:
Gross and Net Revenue Churn Trends: Display these as line charts over the past 12 months. This visual format makes it easy to spot patterns.
Cohort Analysis: Group customers by sign-up month to track their lifecycle behavior. This answers the question: "Are newer customers retained longer than older ones?"
Segmentation by Key Drivers: Analyze churn data by customer size, subscription tier, or industry. This pinpoints where your churn problem is most severe.
Making Churn Data Actionable
Link churn data to specific reasons. A churn rate without context is just a number. Integrate data from exit surveys, support tickets, and account manager feedback. A well-organized CRM is essential for managing this context, as explained in our guide on CRM for inside sales.
An effective churn report explains why churn happened. Attributing churn to root causes—like product gaps or poor onboarding—turns your dashboard into a strategic tool. When you can connect every lost dollar to a specific reason, you give your teams the information they need to prioritize fixes and improve retention.
Answering Your Top Revenue Churn Questions
Here are answers to common questions about tracking revenue churn.
What Is a Good Revenue Churn Rate?
There is no universal "good" number; it depends on your customer base.
As a general guideline, a SaaS company selling to small businesses (SMBs) might have a monthly revenue churn of 3-5%. Companies serving large enterprises should aim for under 1% per month. Enterprise contracts are typically longer with higher switching costs, leading to better retention.
The goal is to achieve a consistent downward trend in your own churn rate over time. Progress is more important than hitting a generic benchmark.
What Is Negative Revenue Churn?
Negative revenue churn occurs when the additional revenue from your existing customers (upgrades and expansions) is greater than the revenue lost from customers who churn.
In simple terms, your existing customers are spending more, and this growth outweighs the losses from churn. This means your business can grow without acquiring any new customers. It is a strong indicator of a great product and a loyal customer base.
How Often Should We Calculate Revenue Churn?
Consistency is key. The best reporting frequency depends on the audience.
For internal teams (monthly): Customer Success and Account Management teams should review revenue churn monthly. This allows them to identify and address issues quickly.
For leadership and the board (quarterly): A quarterly view is better for strategic planning. It smooths out monthly variations and provides a clearer perspective on long-term trends and the impact of major initiatives.
Samskit turns your customer meetings into reliable CRM updates and clear next steps, helping you spot churn risks hidden in conversations. Learn how Samskit provides the context your team needs to improve retention.