

If you run a subscription business, one metric reveals your company's health: Net Dollar Retention (NDR). It cuts through the noise. It measures revenue growth from your existing customers.
When your NDR is over 100%, your business grows on its own. Your current customers spend more through upgrades and expansions. This extra revenue outpaces the money lost from cancellations. You achieve organic growth before making a single new sale.
Why Net Dollar Retention Is a Key Growth Metric
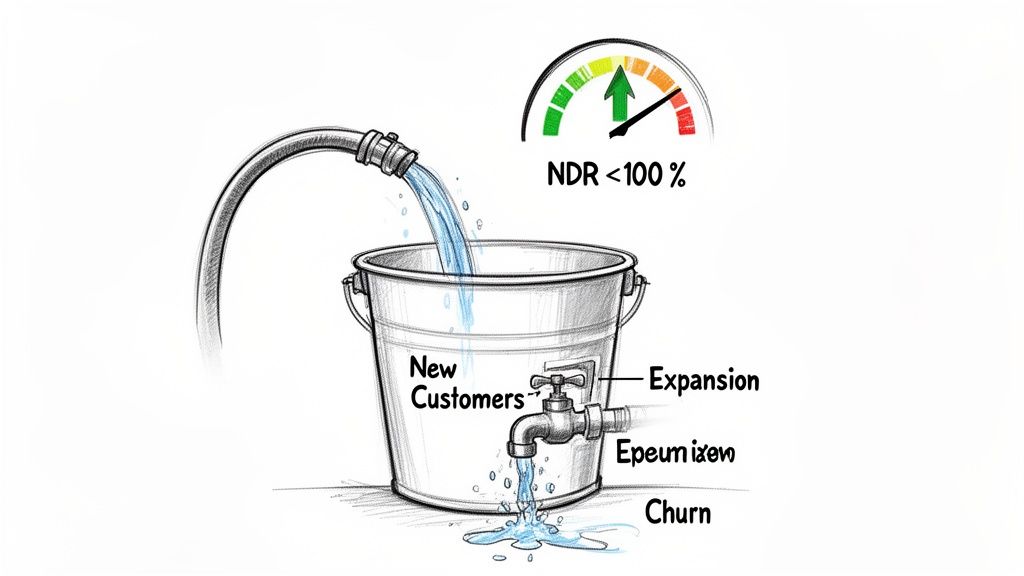
Think of your business as a bucket. New customers are water you pour in. But the bucket has a leak. This leak is customer churn, which drains your revenue.
Net dollar retention asks a simple question: Can you add more water from inside the bucket? This internal source is your expansion revenue. It comes from upsells, cross-sells, and add-ons that current customers buy.
If your NDR is above 100%, this internal source adds more revenue than the leak loses. Your business grows from within. This is a powerful sign of a healthy, scalable company.
A Clear Signal of Product Value
Investors and leadership teams value NDR. It offers an honest look at how much customers value your product. A high NDR means customers stick around. It also means they embed your solution deeper into their operations. This signals three key strengths:
Strong Product-Market Fit: Your product is so useful that customers pay more for extra features or wider access.
Customer Loyalty: Happy customers stay and grow. High retention and expansion result from delivering real-world value.
Efficient Growth: Growing revenue from an existing customer is cheaper and easier than acquiring a new one.
A healthy net dollar retention rate proves you have a sustainable business model. It validates that your product solves a real problem. It also shows your customer success team is effective.
The Foundation of Accurate Tracking
You cannot improve what you do not measure. For NDR, clean data is essential. You need a single source of truth, usually your CRM. It must track every upsell, downgrade, and cancellation. Inconsistent data produces a flawed, unreliable number.
This focus on NDR is a global standard. For instance, top-performing firms in the Brazilian SaaS market report NDR rates over 110%. According to the State of SaaS LatAm 2024 report, this figure shows solid retention. It also points to a thriving, expansion-led growth model.
How to Calculate Net Dollar Retention: A Step-by-Step Guide
Calculating net dollar retention does not require complex financial modeling. It is a straightforward process. It gives you a clear picture of your existing customer base's health. Once you understand the formula, you can turn this metric into a practical tool for your team.
The standard formula for net dollar retention measures the percentage of recurring revenue retained from existing customers over a set period. It includes both revenue gains (expansion) and losses (contraction and churn).
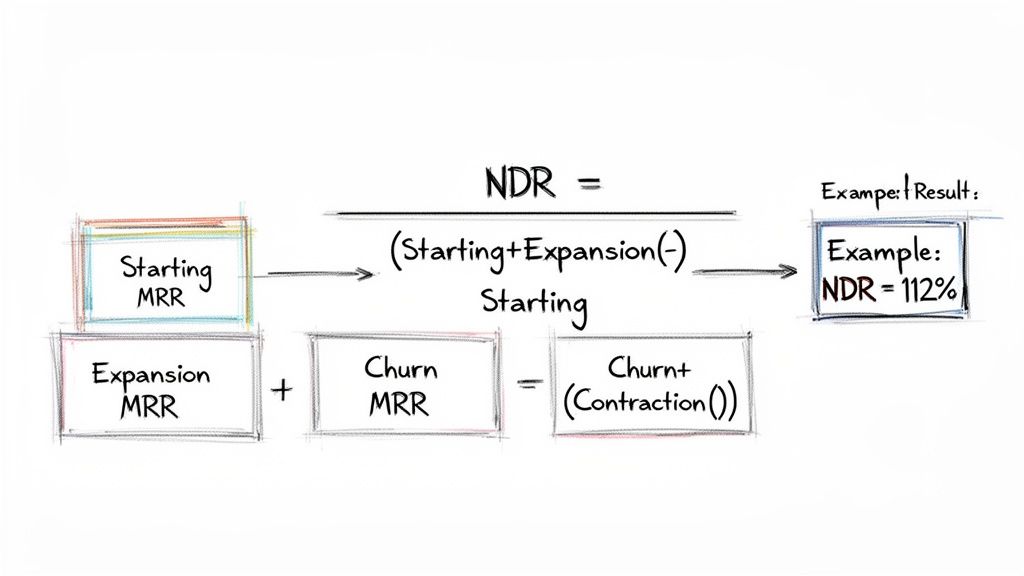
Here is the formula:
NDR = [(Starting MRR + Expansion MRR) – (Churn MRR + Contraction MRR)] / Starting MRR
Multiply the result by 100 to get a percentage. Let's break down each component.
Defining the Core Components of the NDR Formula
To get an accurate number, you must be precise about the four key inputs. Each input tells part of your customer revenue story for a specific period (month, quarter, or year).
Starting MRR (Monthly Recurring Revenue) This is your baseline. It is the total recurring revenue from a specific group of customers at the start of the period. Exclude any revenue from new customers acquired during the period.
Expansion MRR This is growth from your current customer base. Expansion MRR includes all extra recurring revenue from upsells (upgrading to a pricier plan), cross-sells (buying other products), and add-ons (like adding more user seats).
Contraction MRR This tracks revenue lost from existing customers who spend less but do not leave. This includes downgrading to a cheaper plan, removing user seats, or canceling an add-on.
Churn MRR This is the total recurring revenue lost when customers cancel their subscriptions. It represents the most direct form of revenue leakage from your existing customer base.
By isolating these four elements, you can see where your revenue is growing and where it is leaking. This clarity helps you identify a churn problem to fix or an expansion opportunity to pursue.
A Worked Example of an NDR Calculation
Let's walk through a practical example for a fictional SaaS company, "SaaSCo," for the month of April.
SaaSCo starts April with £100,000 in MRR from its customer base as of April 1st. During the month, the following occurs:
Expansion: Several customers upgrade their plans or add more users. This generates an extra £15,000 in Expansion MRR.
Contraction: One large client downgrades its plan, resulting in a loss of £3,000 in Contraction MRR.
Churn: A few smaller customers cancel their subscriptions, leading to a loss of £5,000 in Churn MRR.
Now, we can plug these figures into the net dollar retention formula.
Worked Example of Net Dollar Retention Calculation
This table shows how each component contributes to SaaSCo's final NDR figure for April.
Metric Component | Description | Example Value |
|---|---|---|
Starting MRR | Total MRR from the customer cohort at the start of April. | £100,000 |
Expansion MRR | Additional MRR from upsells and cross-sells in April. | + £15,000 |
Contraction MRR | MRR lost from downgrades during April. | – £3,000 |
Churn MRR | MRR lost from customers who cancelled in April. | – £5,000 |
With these figures, the formula is:
NDR = [(£100,000 + £15,000) – (£3,000 + £5,000)] / £100,000
Here is the step-by-step calculation:
Step 1: Calculate total potential revenue: £100,000 + £15,000 = £115,000
Step 2: Calculate total lost revenue: £3,000 + £5,000 = £8,000
Step 3: Find the final net revenue: £115,000 – £8,000 = £107,000
Step 4: Divide by the starting revenue: £107,000 / £100,000 = 1.07
To get the final percentage, multiply by 100.
SaaSCo's Net Dollar Retention for April is 107%.
This means that for every pound of revenue SaaSCo started with, it ended the month with £1.07 from that same group of customers. The £15,000 in expansion revenue more than covered the £8,000 lost to contraction and churn. This result indicates healthy, sustainable net growth.
The Three Levers That Control Your NDR
Your Net Dollar Retention is not a passive number. It is the direct result of three customer activities: expansion, contraction, and churn. Think of them as levers you can pull to manage your NDR. Understanding how they work connects this metric to the daily work of your teams.
Your customers make decisions every day that affect these levers. Mastering each one is the first step toward improving your NDR.
Lever 1: Expansion Revenue
Expansion drives your NDR past 100%. It is all the revenue you generate when existing customers spend more. This involves nurturing the relationships you already have.
Expansion happens in a few key ways:
Upsells: A customer on a "Standard" plan upgrades to the "Pro" plan for more features. They get more value, and you generate more monthly recurring revenue (MRR).
Cross-sells: A customer using your sales analytics tool also buys your forecasting module. They embed your products deeper into their workflow, making your solution stickier.
Add-ons: A growing team adds 10 new user seats to their account. Their usage increases, and so does their subscription value.
A quarterly business review (QBR) is a practical setting for this. A customer success manager can show ROI and uncover new problems your product can solve. This creates a natural opportunity for an upsell or cross-sell.
Lever 2: Contraction Revenue
Contraction slowly reduces your revenue. It is less dramatic than a customer cancellation, but its cumulative effect can drag down your Net Dollar Retention. Contraction occurs when a customer reduces their spending without leaving completely.
This usually looks like a customer:
Downgrading to a cheaper plan.
Removing user seats they no longer need.
Canceling a specific add-on or feature.
For example, a company reorganizes and reduces its sales team from 50 to 40 reps. They will likely remove 10 seats from their subscription. They are still a customer, but their monthly spend has dropped, which harms your NDR.
Contraction is often an early warning sign. A customer downgrading today could be a churn risk next quarter. Monitoring it gives your team a chance to intervene.
Lever 3: Churn Revenue
Churn is the most direct cause of revenue loss. It is the revenue you lose when a customer cancels their subscription. High churn makes it very difficult to achieve a healthy Net Dollar Retention rate.
Churn signals that a customer is no longer getting value from your product. Reasons can include a poor onboarding experience, a competitor's better offer, or a change in their business strategy. Every cancellation subtracts directly from your revenue base. You can learn more about how acquisition strategies relate to retention in our guide on inbound vs outbound sales.
Your final NDR figure is a balancing act between these three forces. Strong expansion can sometimes mask high churn. However, the most sustainable businesses excel at both growing customer accounts and minimizing revenue loss.
Actionable Strategies to Improve Net Dollar Retention
Knowing your net dollar retention is one thing. Improving it is another. Boosting your NDR requires a coordinated effort across your customer-facing teams. They must move from reactive problem-solving to proactive partnership.
This means implementing specific, repeatable playbooks for your sales, customer success, and account management teams. The focus must be on the three core levers: churn, contraction, and expansion.
The goal is to build a culture where retaining and growing customer revenue is part of everyone's job. Here are practical strategies to make that happen.
Fortify Onboarding and Customer Success
A high net dollar retention rate is often decided in the first 90 days. A confusing onboarding experience leads to churn. A smooth one lays the groundwork for a long-term, expanding relationship.
Your Customer Success team should own this process. They should act as strategic advisors, not just support staff.
A solid customer success playbook should include:
Proactive Health Checks: Monitor product usage data to spot accounts with low adoption. Do not wait for a support ticket. Reaching out before they become a churn risk makes a significant difference.
Structured Onboarding: Guide every new customer through a clear, repeatable process. This ensures they achieve key value milestones and get their first "win" with your product quickly.
Value-Based QBRs: A Quarterly Business Review should be a strategic conversation about the customer's ROI. Show them the value they have gained. Map out how you can help them hit their next goal.
Equip Account Managers to Drive Expansion
Your Account Management team is your main engine for expansion MRR. They need more than a list of accounts to call. They must be equipped to spot and act on growth opportunities. Their focus should shift from simple renewals to growth partnerships.
Do not rely on gut feelings. Create clear, data-driven triggers that tell account managers when to start a conversation.
Build expansion playbooks around triggers like:
Usage-Based Signals: Set up alerts for when a customer approaches plan limits, like user seats or API calls. This creates a natural moment to discuss an upgrade.
Feature Requests: If a customer asks for a feature that exists in a higher-tier plan, it is an upsell opportunity. Your team needs a process to act on these requests immediately.
Organizational Changes: If a customer is hiring for a new department or expanding into a new market, these are strong expansion signals. Train your account managers to look for them.
The most effective way to drive expansion is to align your product's value with the customer's evolving needs. When they succeed and grow, your revenue should grow with them. This creates a natural partnership that boosts NDR.
Align Sales with Long-Term Retention
Retention starts with the first sales call. If the sales team sets the wrong expectations or sells to a poor-fit customer, they set up the Customer Success team for failure. This misalignment causes early churn that hurts your net dollar retention.
A simple fix is to tie a small part of sales compensation to customer retention. This gives salespeople a financial incentive to close good-fit deals that last.
A clean, detailed handoff from Sales to Customer Success is also non-negotiable. This process must transfer crucial context: the customer's goals, pain points, and any promises made during the sales cycle. You can find out more about setting up your teams for better data handoffs in our article on CRM best practices for inside sales.
A clear data workflow is crucial here. In Brazil's SaaS sector, net dollar retention is a key driver of resilience. By automatically syncing call insights from Google Meet to HubSpot, tools like Samskit eliminate the context gaps that erode retention. This allows revenue leaders to spot churn risks or expansion signals early. This is vital in a market where the 2020 rollout of the Pix payment system accelerated SaaS adoption and customer loyalty. You can discover more insights about how market dynamics shape business futures on bcg.com.
Common Pitfalls in Measuring NDR (and How to Sidestep Them)
An untrustworthy NDR number is worse than no number at all. A flawed calculation can mislead your leadership. It can hide a serious churn problem or create a false sense of security. A reliable NDR depends on clean data and a consistent measurement process.
Many businesses suffer from the "garbage in, garbage out" problem. If your CRM is messy or teams define terms differently, your NDR calculation will be unreliable. For any RevOps leader building a data-driven growth strategy, getting this right is essential.
Mistake #1: Mixing One-Off Fees into Recurring Revenue
This is a common error. Teams include one-time charges with recurring revenue. This breaks the logic behind net dollar retention. NDR is designed to track the health of your subscription relationships.
The Pitfall: Your team counts professional services fees, setup costs, or training sessions as MRR. This inflates your NDR. It makes it look like you have strong organic growth when it is really just transactional revenue.
The Fix: Strictly separate recurring from non-recurring revenue in your CRM and financial reports. Your NDR calculation should only include predictable, subscription-based income.
It is vital to keep these separate. A one-time setup fee is a transaction. A monthly subscription upgrade is a commitment. NDR measures that ongoing commitment.
Mistake #2: Using Fuzzy or Inconsistent Definitions
What happens when your sales, finance, and customer success teams define "churn" or "expansion" differently? You get chaos. This lack of alignment leads to conflicting reports and mistrust in the data.
It comes down to simple questions. Does churn occur when a customer clicks "cancel," or at the end of their billing cycle? Is adding five new users an "upsell" or an "add-on"? These small details can have a big impact on your final calculation.
How to Get Everyone on the Same Page: A Checklist
[ ] Create a Central Glossary: Document the exact definition for every NDR component (Churn MRR, Expansion MRR, Contraction MRR) in a shared location.
[ ] Define the Triggers: Specify the exact event that marks a revenue change. For example: "Churn MRR is recognized on the final day of a customer's paid contract."
[ ] Automate the Process: Use workflows in your CRM (like Salesforce or HubSpot) to automatically tag revenue changes based on your rules. This removes human error.
Mistake #3: Not Breaking Down Your Customer Cohorts
A single, company-wide NDR figure can be misleading. It can hide major problems. For example, a massive expansion from one enterprise client could mask high churn among your SMB customers. This is a huge blind spot. You have to dig deeper.
Analyzing NDR by customer cohort provides a sharper, more honest view of your business. It helps you answer important questions:
Do customers from a specific marketing channel retain better?
Is our NDR for enterprise clients stronger than for mid-market accounts?
How does retention differ for customers who use a key feature versus those who do not?
By segmenting your data, you move from a vague metric to actionable insights. It allows you to find weak spots in your strategy and focus on what works. This ensures your decisions are based on a real understanding of customer behavior.
How Clean Data Powers Higher Net Dollar Retention
You cannot improve what you do not measure. You cannot measure accurately with bad data. Every strategy for lifting your net dollar retention relies on a foundation of clean, reliable CRM data. If your data is wrong, your NDR figure is meaningless.
A flawed number can hide churn problems or conceal expansion opportunities. Your teams end up making strategic decisions based on a distorted view of reality.
Customer data is often messy. It is scattered across different systems. It relies on busy people to enter every detail manually. A sales rep forgets to log a call. A CSM misinterprets a feature request. An account manager misses a subtle churn warning sign in a meeting. These small errors add up, polluting your CRM and making your NDR calculation unreliable.
Meeting intelligence platforms can solve this problem. They create a direct, automated link between customer conversations and your CRM. This bypasses the errors of manual data entry.
Automating the Flow of Customer Truth
The process is simple but the impact is significant. A tool like Samskit can automatically join your calls on platforms like Google Meet or Zoom. It then records and transcribes the entire conversation. This gives you a perfect, searchable record of what was said.
Instead of relying on a rep's notes or memory, your teams get objective, actionable insights. The platform’s AI analyzes the conversation to flag important moments:
Expansion Triggers: A customer mentions a new business goal that your premium features could solve.
Churn Risks: A customer's sentiment turns negative, or they mention "exploring other options."
Objections and Concerns: A customer questions pricing or expresses frustration with a workflow.
These critical data points are then automatically synced to the right fields in your CRM. This keeps your data clean for NDR calculations. It also gives your team real-time alerts to act on opportunities and prevent risks. If you're curious about how technology can sharpen your sales efforts, our guide on tech prospecting is a great next step.
From a Single Comment to a Major Expansion
Here is a practical example. An account manager is in a quarterly business review. The customer mentions, "We're launching a new product line in Europe next quarter." Without an automated system, this key detail might get lost.
With meeting intelligence, that phrase is captured, transcribed, and flagged as an expansion opportunity. The system can even create a task in the CRM for the account manager to follow up with information on your international support plans. A casual comment becomes the catalyst for a major upsell, directly boosting your net dollar retention.
This infographic breaks down the common failure points. It all starts with bad data and ends with a bad strategy.
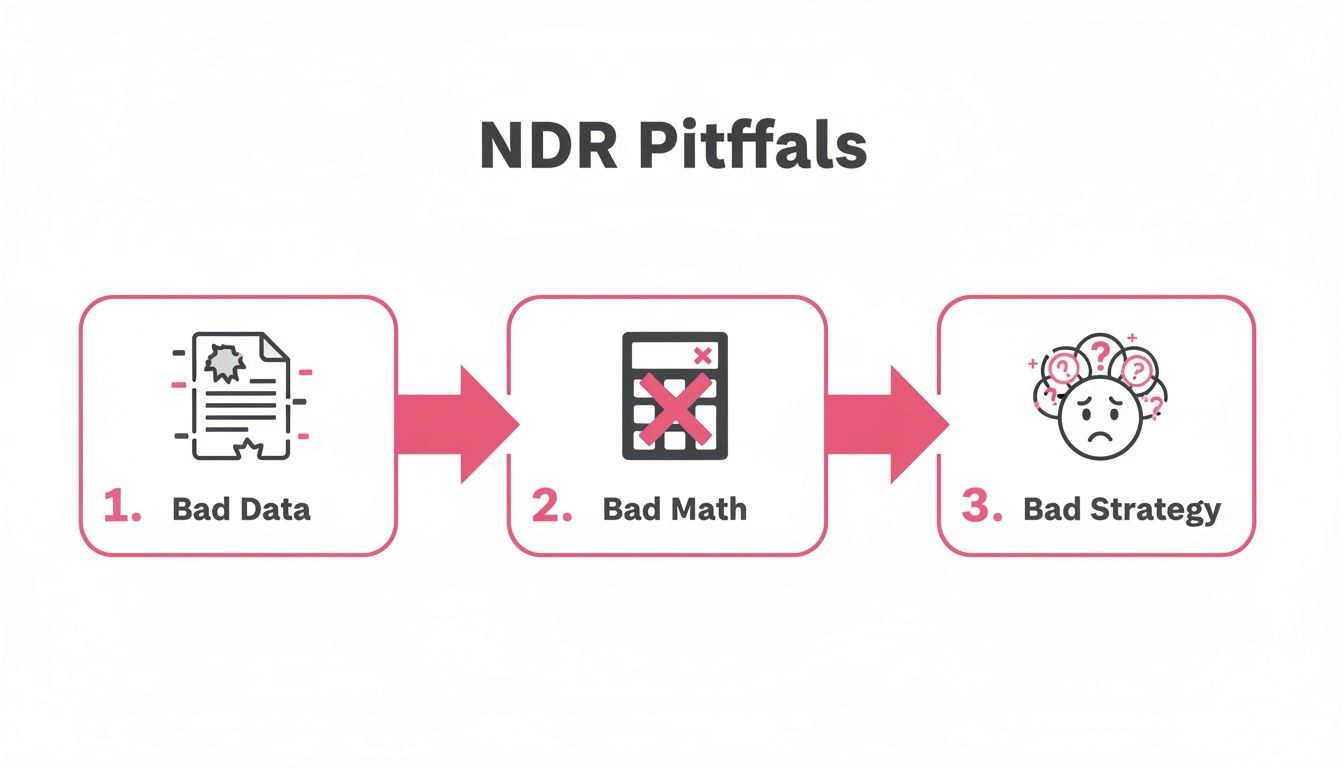
The domino effect is clear. Corrupted data leads to flawed calculations, which leads to misguided business strategy. By fixing the problem at the source—ensuring CRM data is accurate and complete— you empower your teams to measure, understand, and improve NDR with confidence.
Your Top Questions About Net Dollar Retention, Answered
Here are answers to common questions about Net Dollar Retention. Understanding these concepts is key to using the metric effectively.
What’s a Good Net Dollar Retention Rate?
The "right" number depends on your industry and customer base. However, a net dollar retention rate over 100% is a universally positive sign. It means your revenue gains from existing customers are greater than your losses from churn and downgrades.
For most B2B SaaS companies, an NDR between 100% and 110% is a solid target. Top-tier public SaaS companies, especially those serving enterprise clients, often report rates of 120% or higher. A figure like that shows investors that your product is very sticky and customers find immense value in it.
How Is Net Dollar Retention Different from Gross Retention?
These two metrics are easy to confuse, but they tell different stories. The key difference is expansion revenue.
Gross Dollar Retention (GDR) measures how well you hold on to your initial revenue. It ignores new money from upsells or cross-sells. Its maximum value is always 100%. It answers the question: “How much of our starting revenue did we keep?”
Net Dollar Retention (NDR) includes expansion revenue to show the complete picture. That is why it can exceed 100%. It answers a broader question: “What was the total revenue change from our existing customers after all churn, downgrades, and upgrades?”
Think of it this way: GDR measures your defense—your ability to prevent revenue loss. NDR measures your offense—your ability to grow revenue from the customers you already have.
How Often Should We Calculate NDR?
Consistency is the most important thing. Pick a cadence and stick to it. This will help you spot trends over time.
Most SaaS businesses calculate NDR on both a monthly and quarterly basis. Monthly tracking helps operational teams see recent shifts in customer behavior and react quickly. Quarterly and annual views provide a more stable, big-picture perspective for board meetings, investor updates, and long-term strategic planning.
Samskit turns customer meetings into reliable CRM updates and clear next steps, ensuring you capture the expansion triggers and churn risks that directly impact your net dollar retention. See how it works.